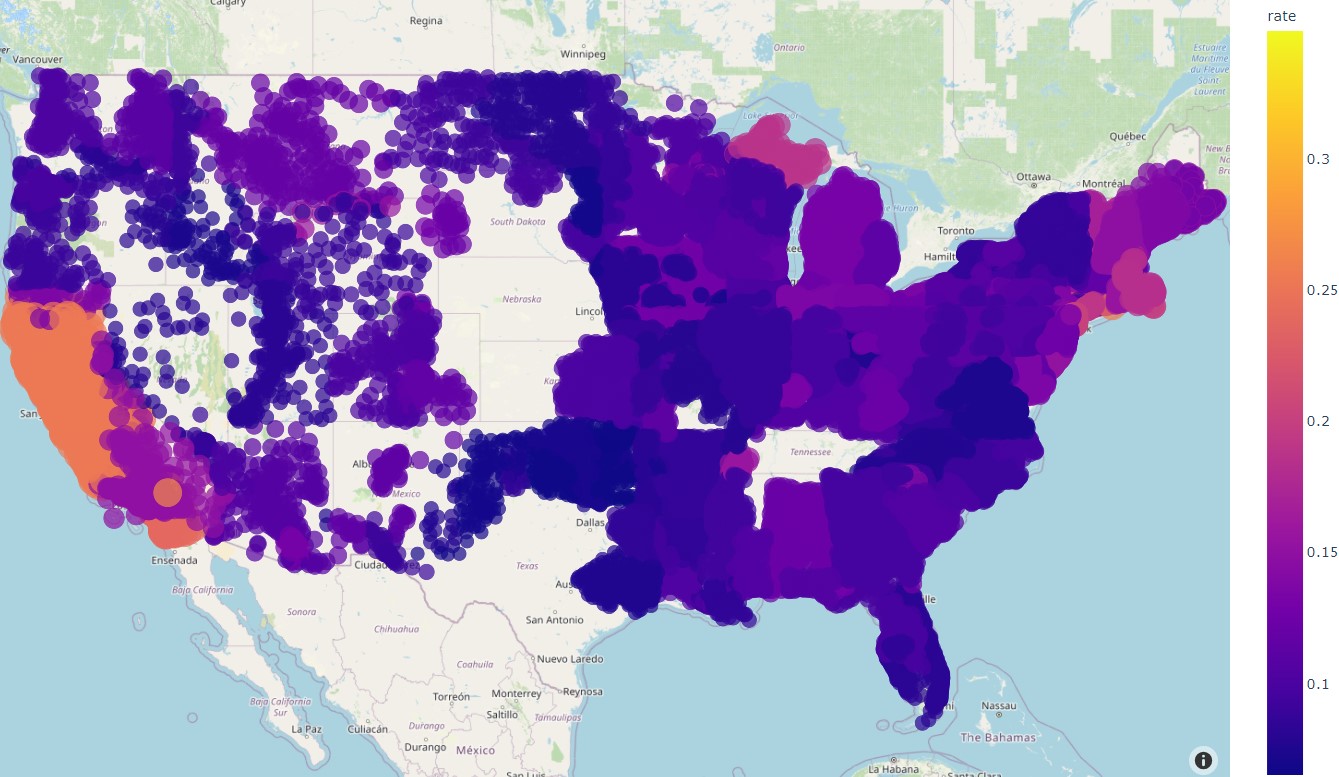
This website is a tool for the public to look into the electricity rate data nationwide through visualizations and data. The home page allows the user to pick from an array of visualizations and then generates the visualization based on the preferred options. For this project, we are using Firebase for the database and Google Cloud Run to host the Flask application for the web application. The front-end framework being used is Bootstrap, and the visualizations are made with Plotly. This project was completed with partners Alexander Schmig and Bryan Walters.

The GitHub repository can be found on GitHub here. More information can be found via the ReadMe in the repository.
