This project focuses on visualizing two volcanic eruptions in 2011 based on the ash index and SO2 data. Working with project partner, Anna Everett, we were able to create animations showing the aftermath of these volcanoes through ash and SO2.
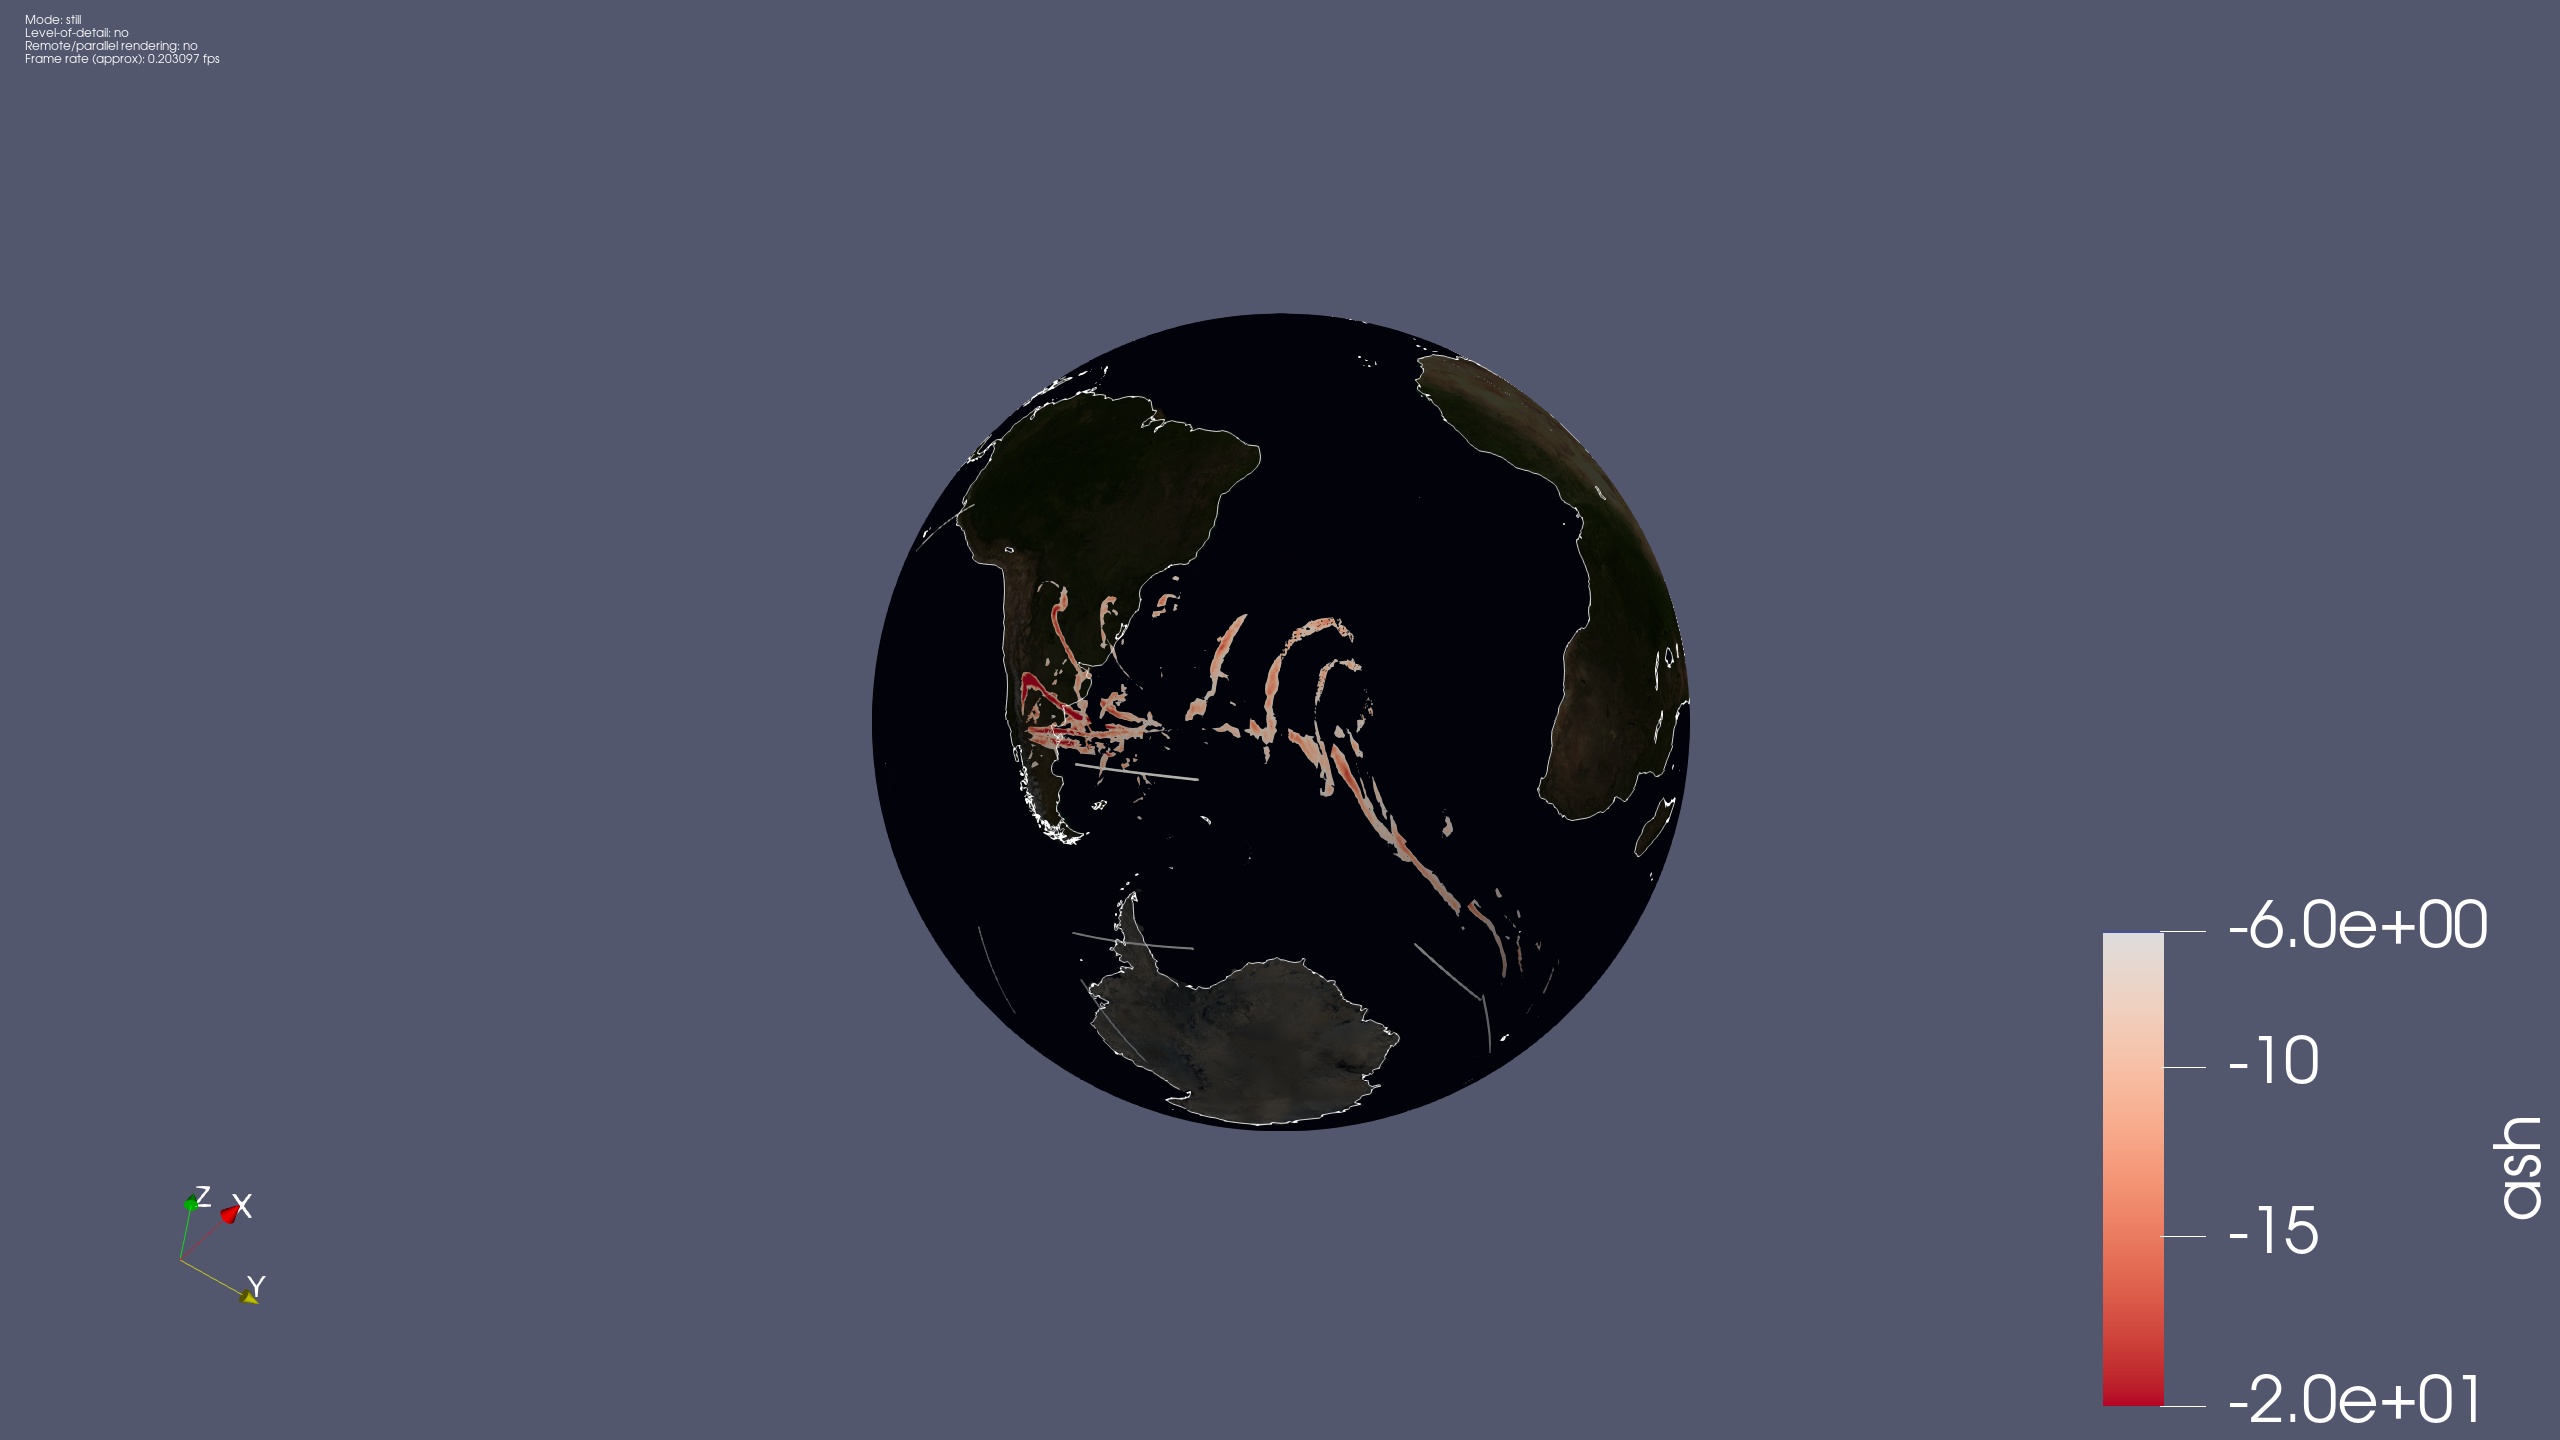
These visualizations come from 2 separate volcanic eruptions. The first eruption in Southern Chile, the Puyehue eruption, happened on June 4, 2011 and the second eruption in North East Africa, Eritrea, took place on June 11 2011. The Ash Index visualizations are from the Chile eruption. The SO2 visualizations are from the Eritrea eruption.
Using Scientific Visualization software, ParaView, we were able to create animations visualizing these eruptions using satellite data. Each frame of the animation represents 12 hours of satellite data. For more information, click on the project link. The YouTube links for the animations are in the ReadMe.